


Holiday Hazards: Small Business Incidents Over Christmas & New Year’s
Each year, the Christmas–New Year stretch brings a particular kind of pressure for Australian small businesses: trading patterns shift, customers surge or disappear overnight, and teams juggle end-of-year fatigue with summer weather intensity.
To understand what that really looks like in practice, BizCover analysed claims lodged for incidents occurring between 1 December and 31 January across 2019 to 2025, with a close eye on peak “special days” like Christmas, Boxing Day and New Year’s Eve. The results are clear: risk doesn’t take a holiday.
Sharon Kenny is the Head of Marketing at BizCover. She puts it like this: “The festive season might feel like a break for some, but for many businesses it’s one of the most intense periods of the year.
“Understanding when and how incidents tend to happen over this window helps owners plan smarter, whether that’s rostering on extra staff to meet demand, making equipment checks before the heat hits, or tightening security before closing the doors.”
From the most at-risk industries to the days where incidents spike, here’s what the data tells us about the most common risks during the Australian summer holiday period.
Key Takeaways
- Trades, Hospitality and Retail are the industries most affected during the Christmas–New Year period.
- 10% of all incidents occur on “special days” (24, 25, 26 and 31 December, and 1 January).
- Hospitality is the most likely industry to experience a “special day” incident (31%).
- Christmas Day (25 December) is the second most common incident date, behind 15 January.
- Third Party Property Damage accounts for almost one in four holiday-period incidents (24%).
- Incidents peak on Mondays, with both December and January recording their highest volumes at the start of the week.
Industries with the most incidents

In Australia, the holiday trading period does not look the same for all businesses. While some shut down over the Christmas-New Year period (and sometimes for the entirety of January), others enjoy their busiest trading period of the year. These differences in operations are revealed in the claims data.
The top 5 industries hit the hardest during the holiday trading period are:
- Trades: 42%
- Hospitality: 19%
- Retail: 10%
- Services: 7%
- Health Services: 5%
Trades dominate the holiday incident picture, accounting for 42% of all claims recorded in December and January across 2019–2025. In the lead-up to the Christmas season, tradies are often booked up as homeowners rush to urgently get building projects completed before the big family get-together.
“Longer daylight hours and compressed end-of-year timelines can also mean more jobs packed into fewer weeks, which naturally lifts exposure to accidents and mishaps,” says Kenny.
Hospitality comes next at 19%, which is also not surprising: restaurants, cafés, bars, and venues take on higher customer volumes, extended trading hours, and more casual or temporary staff. With more moving parts – busy kitchens, crowded floors, late nights – there are simply more opportunities for something to go wrong.
Retail (10%) and Services (7%) follow in the same pattern. These are industries tied closely to consumer behaviour, and summer trading plus holiday spending creates a steady stream of activity even when other sectors slow down. Health Services (5%) round out the top five, reflecting the fact that care work can’t pause for public holidays. Clinics, specialists, and allied health providers need to remain open because injuries and illnesses don’t stop during the holidays.
These are the industries that essentially carry the holiday period.
Kenny says, “When customers are celebrating, travelling, eating out, shopping, or fixing things at home, they want and need certain businesses to remain open. And where there’s sustained activity, incidents will follow.”
Industries most likely to experience a “special day” incident
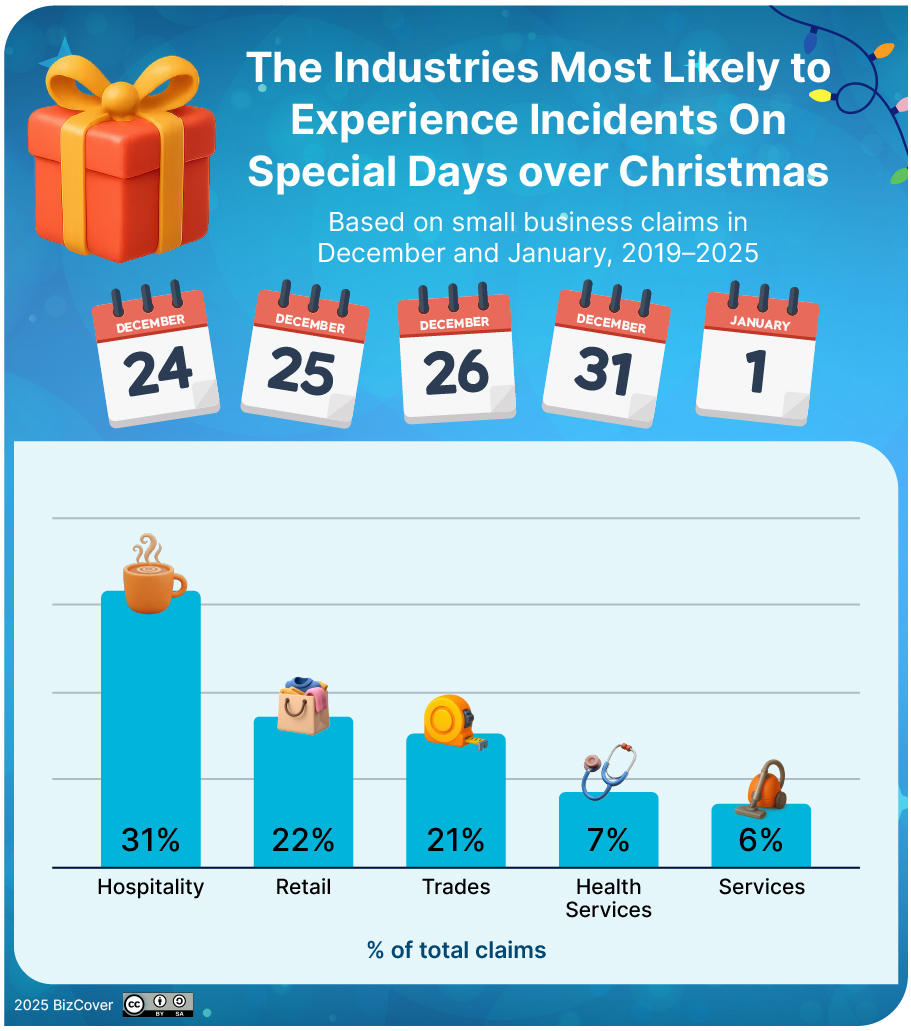
Looking specifically at incidents that happened on the key “special days” (that is, 24, 25, 26 and 31 December, and 1 January), the story shifts. The businesses that are often operating on these dates are operating under variable conditions – trading patterns change, hours are variable, and customer behaviour could become unpredictable.
The top 5 industries most likely to experience an incident on these days are:
- Hospitality: 31%
- Retail: 22%
- Trades: 21%
- Health Services: 7%
- Services: 6%
Hospitality jumps to the top, making up 31% of all special day incidents. These are the venues that are likely to see the biggest surge in trading activity as people catch up with family and friends, outsource Christmas day cooking, welcome in the new year, and generally get out and about to socialise. Bigger crowds, longer sittings, late-night trading – these factors can sometimes bring a perfect storm of rushed service and occasionally messy and erratic customer behaviour.
Retail comes in second with 22%. “With these special days often tied closely to shopping surges – last-minute Christmas shopping, Boxing Day specials, the pre-party dash for New Year’s Eve – it’s no surprise that the Retail sector sees an increase in incidents,” says Kenny. “Busier trading can heighten exposure to risks like equipment and technology failures, customer incidents, theft and accidents.”
Trades drops down to third place at 21% likely because most tradies pause for the public holidays. This leaves them less exposed to risks on these particular special days themselves. On special days, the rate of incidents drops by half for Trades.
Health Services (7%) and Services (6%) round out the top five, showing that some industries never fully shut down, even over public holidays.
What these numbers show is that “special day incidents” are less about bad luck and more about compressed trading and customer demand.
“When activity spikes in a short window, risks are concentrated, too,” says Kenny. “While the focus of the season is about celebrating with loved ones and welcoming in a brand-new year, businesses are often under a lot of pressure to meet the demands of their customers.”
Top 5 incident categories for December–January
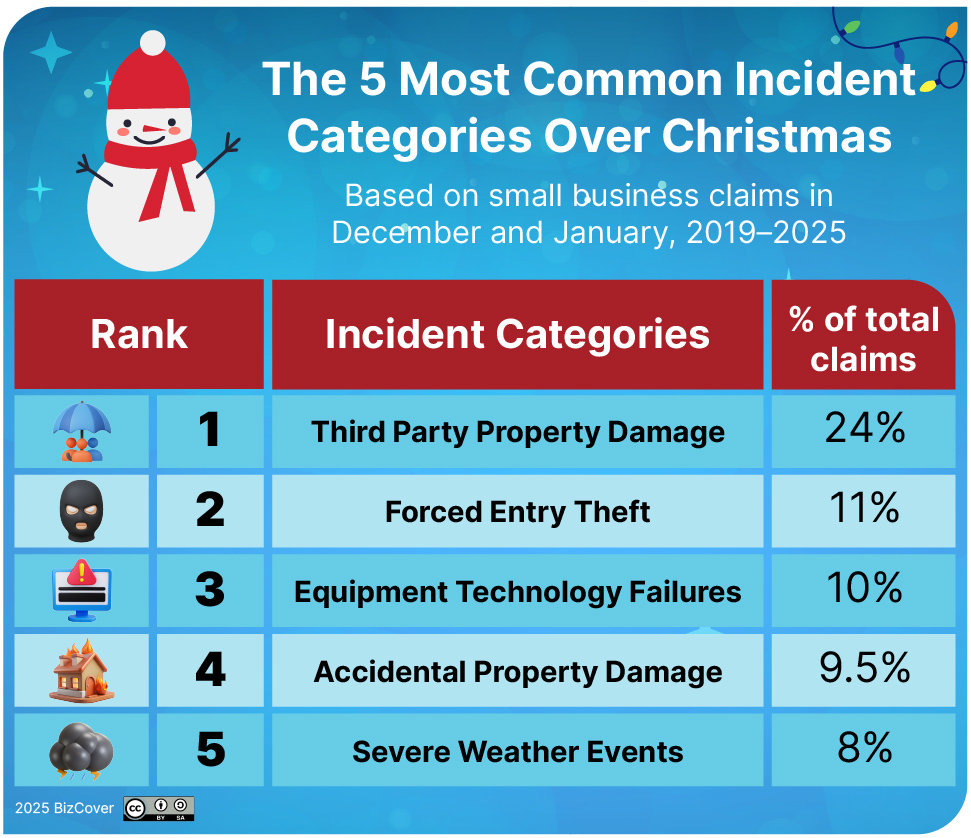
The top five incident categories from 1 December to 31 January are:
- Third Party Property Damage: 24%
- Forced Entry Theft: 11%
- Equipment & Tech Failures: 10%
- Accidental Property Damage: 9.5%
- Severe Weather Events: 8%
The leading category, Third Party Property Damage (24%), sits well ahead of the rest. At a time where certain businesses see a sharp spike in foot traffic, the risk of Third Party Property Damage occurring is unsurprisingly heightened. Whether it’s a customer incident in store, a runaway vehicle crashing through a shopfront, or an accident on a job site, higher foot traffic combined with the pressures of the season can lead to higher exposure to property damage.
Forced Entry Theft steals second place with 11%. While many businesses remain open during this time, there are also plenty that close down – especially over the public holidays. This gives thieves the perfect opportunity for break-ins. These kind of theft incidents during the holiday period may also go undetected for longer, especially if the business is closed down for an extended period of time for the holidays.
“Risks don’t disappear just because a business is closed down for a time,” says Sharon. “In fact, closures can create a different kind of exposure. It’s worth ensuring you have the right security measures in place before you shut down for the season.”
Heat, higher workloads, and businesses running long days at peak capacity can push equipment harder than normal, which may explain why Equipment and Tech Failures come in at 3rd place (10%).
Then there’s Accidental Property Damage (9.5%), which acts as a reminder that not every claim is tied to big trading spikes or extreme events. Busy periods mean rushed setups, tight turnarounds, and workplaces full of people and stock.
Rounding out the top five is Severe Weather Events (8%). Summer in Australia can bring heavy rain, strong winds, severe heatwaves, sudden floods and devastating storms. Even a single event can cause a range of issues for a business. Unlike the other categories we’ve looked at so far which reflect trading trends and customer behaviour, this one reflects the season itself.
So, when you put this data together, what does it tell us?
“This mix of incidents paints a clear picture,” says Kenny. “The holiday period doesn’t necessarily create new risks, but it does reshape where and how risks occur.”
The most common days for incidents in December and January
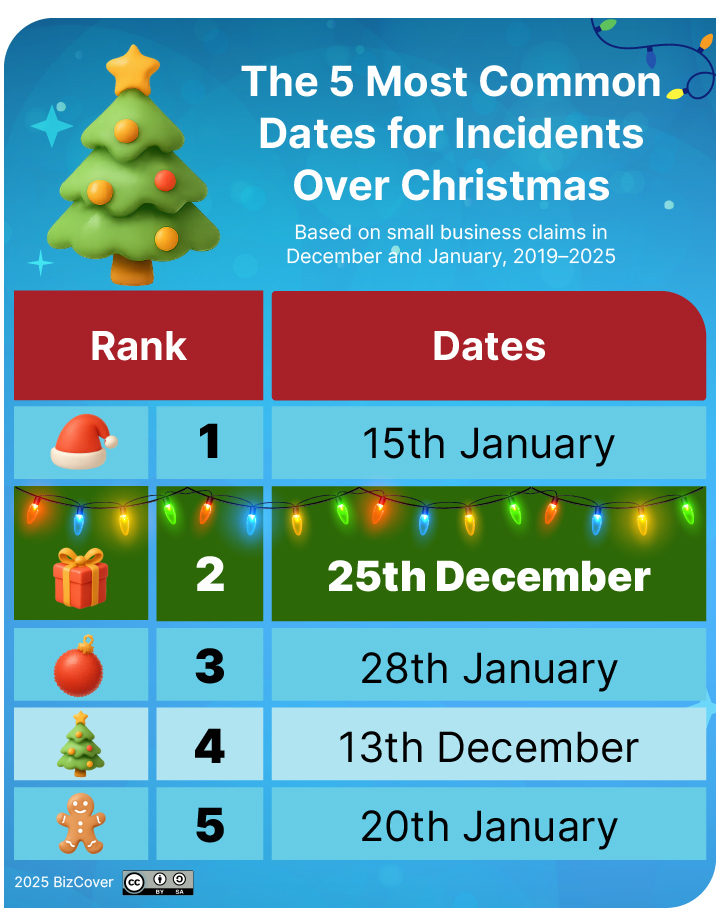
The timing of claims over the Christmas–New Year period tells a story that’s just as interesting as the categories themselves. Rather than clustering only around public holidays or the obvious “busy days,” incidents appear across a broad range of dates from mid-December to late January.
The five most common incident dates across the dataset are:
- 15 January
- 25 December (Christmas Day)
- 28 January
- 13 December
- 20 January
“Straight away, this tells us two things,” says Kenny. “By the 15th of January, most businesses are either already open or beginning to start up operations again. After a shut down period, this is a natural point where incidents can spike.”
She continues, “Secondly, Christmas Day is the second highest day for incidents. For some businesses, this is not a day they can afford to take off. Incidents happening on 25 December reflect venues hosting celebrations, stores trading in tourist areas and health services that need to remain open.”
In addition to this, Mondays are shown to be the most common day for incidents across both December and January. This likely reflects a mix of discovery and demand. Some issues may occur quietly over a weekend or closure window and only get noticed when doors reopen. In other cases, Monday is simply when businesses hit their stride again. It’s all hands on deck again as staff return, deliveries arrive, equipment is switched back on and work returns.
“The timing shows a real holiday arc rather than a single danger zone,” says Kenny. “Incidents rise into mid-December, continue right through Christmas Day, and peak again as businesses restart in January, with Mondays standing out as the moment risks are most likely to surface.”
Wrapping up the holiday season: What does the data show?
Incident patterns across the data suggest the festive season creates unique pressure points for small businesses, from customer surges to equipment strain. Instead of creating new, seasonality-driven risks, the holiday period simply brings them to the forefront (with the exception of severe Summer weather events).
“The clustering of incidents around Christmas Day and the mid-January restart is especially useful for planning,” points out Kenny.
For many businesses, risk rises at exactly the moments when operations are either at their most intense (special-day trading) or getting back up to speed after a break (January ramp-up). Knowing this may help owners think ahead about roster coverage, reopening routines, and maintenance schedules in the weeks that matter most.
The weekly pattern adds another practical takeaway: Mondays consistently produce more incidents in both months. Whether that’s because issues emerge after a closure or because Monday trading comes with a “back-into-gear” rush, it reinforces the value of structured reopening checks: such as walking the site, testing equipment, resetting safety protocols, and making sure the first day back is controlled, not chaotic.
Finally, the leading claim types (Third Party Property Damage and Equipment/Tech Failures) underline where preparation pays off.
“Holiday risk is generally tied to the operational realities of a busy trading period: Busy spaces, fast turnarounds, overworked tools and vacant premises,” observes Kenny.
Small steps like equipment servicing before December, refresher safety reminders with staff, and tighter security during closures may help to cut down the most common holiday-period exposures.
In other words, the festive season may change the pace of business, but it doesn’t change the fundamentals. The businesses that thrive through it are the ones that are able to plan ahead with a little extra care where the data shows risk tends to rise.
Methodology
This analysis draws on BizCover incident data recorded through insurance claims lodged between December 2019 and January 2025.
Only incidents that occurred in December and January were included, providing a focused view of small-business risk during the Christmas–New Year period.
Incident records were reviewed and categorised by industry, incident type, and incident date.
“Special days” – 24, 25, 26 and 31 December, and 1 January – were grouped to identify patterns on key public holiday and festive dates.
The dataset reflects trends within BizCover-insured small businesses and offers an indication of the types of incidents that commonly occur during the festive trading period.
This information is general only and does not take into account your objectives, financial situation or needs. It should not be relied upon as advice. As with any insurance, cover will be subject to the terms, conditions and exclusions contained in the policy wording or Product Disclosure Statement (available on our website). Please consider whether the advice is suitable for you before proceeding with any purchase. Target Market Determination document is also available (as applicable). © 2026 BizCover Pty Limited, all rights reserved. ABN 68 127 707 975; AFSL 501769.

![[Press Release] BizCover Adds Zurich Professional Indemnity to its Online Platform](https://www.bizcover.com.au/wp-content/uploads/Untitled-5-5.png)
![[Press Release] BizCover Among Australia’s Best Managed Companies 2025](https://www.bizcover.com.au/wp-content/uploads/Best-Managed-Companies-LI-social-card-template-2025-1-scaled.jpg)


