Business Theft Report 2025: Most Targeted Industries, Items and Locations
Small business theft is a costly reality for Australian SMEs. From disappearing cash to stolen tools and stock, theft can strike businesses of every size and sector when they’re least expecting it.
So, which businesses are the most targeted? And what are thieves actually taking? Most importantly, are there patterns business owners can learn from to better protect themselves?
To find out, we analysed business theft claims submitted to BizCover from across Australia between January 2022 and August 2025. Each claim was carefully reviewed and categorised by sector, business type, state and postcode. We examined trends over time – including the day of the week, month, and year incidents occurred – as well as how long it took businesses to lodge claims after an incident.
Sharon Kenny is the Head of Marketing at BizCover. She believes this kind of data can provide valuable insights for small business owners.
“This report provides an expansive snapshot of current theft patterns across small businesses nationwide,” says Kenny. “The data reveals not only where and when theft is most likely to strike, but also what’s at risk. This can help them stay one step ahead of thieves.”
From the most vulnerable sectors to the most brazen thefts, here’s what the data tells us about the state of small business theft in Australia.
Key takeaways
- Food and drink (hospitality) is the most stolen-from sector, followed by retail and beauty, together representing over half of all business thefts.
- Cash, tools and tech devices are the most commonly stolen items.
- Thefts occur year-round, with September historically the peak month and Monday the most common day of the week to be stolen from.
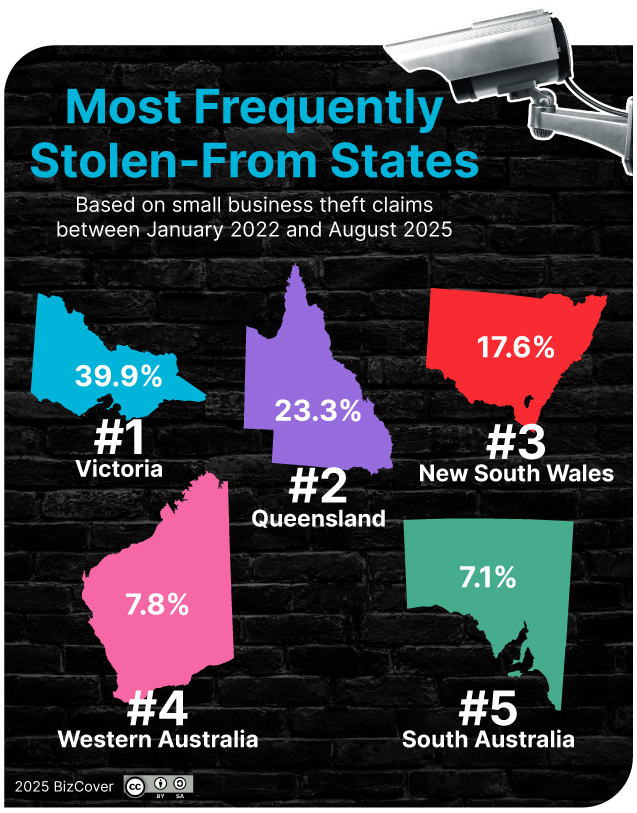
- Victoria records the largest share of business theft claims, followed by Queensland and New South Wales.
- Unusual stolen items (from picnic tables to collectible trading cards) highlight how varied business theft can be.
- Business theft is up 20% in 2025 (January–August) compared with the same period in 2024, reversing the decline seen the previous year.

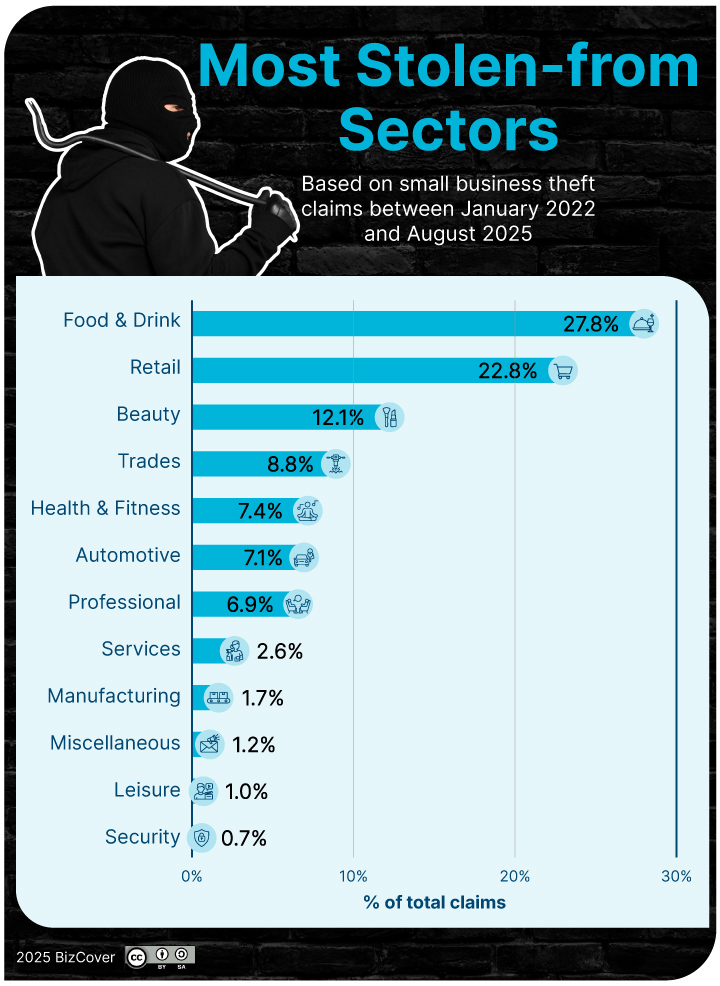
Most stolen-from business sectors
When it comes to business theft, food and drink businesses make up 28% of all theft incidents in our dataset. This includes cafes, coffee shops, takeaway shops, bottle shops, restaurants and other hospitality businesses. This makes food and drink businesses the most targeted sector, with retail in second place (23%). Clothes stores, grocery shops, phone stores and other retail businesses are all prime targets for thieves.
Beauty businesses (including salons, spas, and cosmetic retailers) rank third, responsible for about one in eight thefts (12%). The combination of high-value products and public accessibility could be what makes beauty businesses sector particularly vulnerable.
Trades businesses, such as electricians, plumbers and other service operators, claim fourth position. With expensive tools and equipment often stored in vehicles or on job sites, tradies can become the victims of opportunistic thieves.
Health and fitness businesses round out the top five, contributing to 7% of all theft incidents.
Combined, these top five sectors account for more than three-quarters of all business theft claims.
Smaller sectors such as automotive, professional services and manufacturing each contribute less than 10% individually; but their presence diversifies the theft landscape and reminds us that no industry is entirely immune.
“What stands out is how concentrated the risk is among certain sectors,” says Kenny. “Food and drink businesses, retail shops, and beauty salons operate in customer-facing environments where access is relatively easy and high-value items are on display or close at hand. On the other hand, tradies face a slightly different challenge.
“Understanding your sector’s specific risks is the first step toward implementing effective protective measures.”
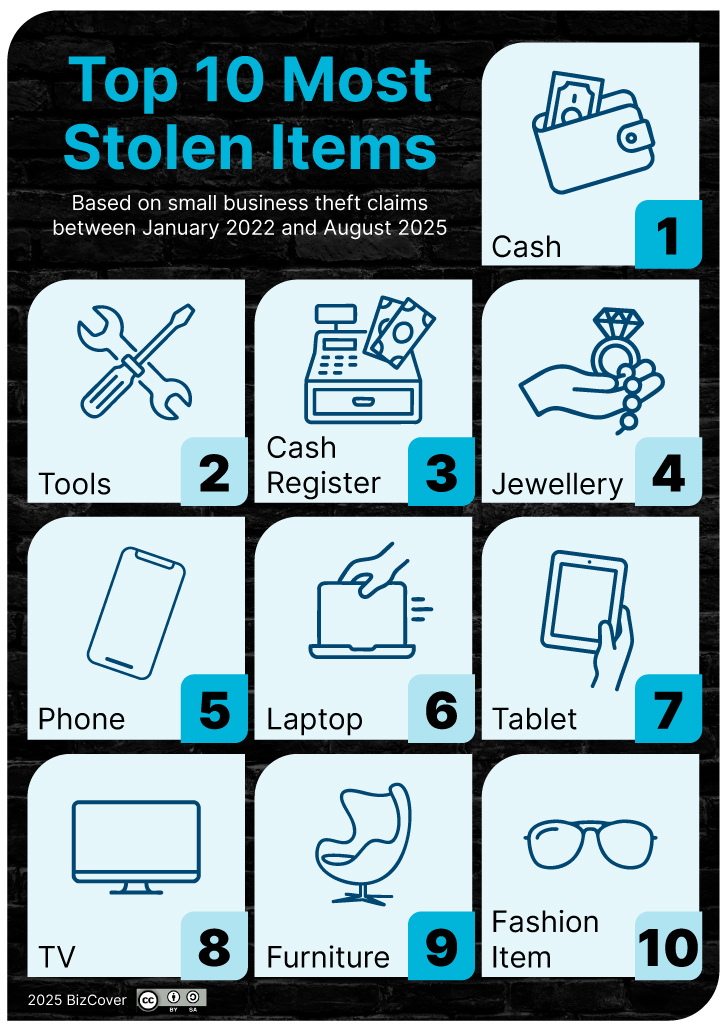
The most stolen items
When it comes to what thieves are after, cash is king. Appearing in just over one in five theft claims (20%), it’s by far the most stolen item. This is a crucial reminder that despite the shift toward digital payments, physical currency is still a major target for criminals.
Tools rank second, accounting for around one in ten incidents (11%). For tradies and service-based businesses, the loss of essential equipment isn’t just a financial blow – it can also bring work to a standstill.
Cash registers are the third most targeted item, with almost the same frequency as tools.
Jewellery and tech devices (including phones, laptops and tablets) together represent nearly one-quarter of all stolen property. These high-value, easily transportable items remain easy targets for thieves.
Beyond the usual suspects, other recurring targets include furniture, fashion items and keys. But the data also reveals some genuinely unusual losses. Among the more noteworthy items we saw were a mannequin, neon signage, aviation headsets and $90,000 worth of collectable trading cards.
“The breadth of what’s being stolen is interesting,” says Kenny. “It shows that thieves are becoming more sophisticated and selective about what they take. From everyday stock and essential equipment to high-value niche items, virtually anything can be a target if a thief understands its value.”
When does business theft occur?
Understanding when business theft is most likely to happen can help owners improve security during vulnerable periods. Our data reveals clear patterns across years, months and days of the week.
Business theft over time
The trajectory of business theft has been anything but stable in recent years. Incidents increased by around 14% between 2022 and 2023, before easing by nearly 7% in 2024. Then, they spiked again 2025.
Comparing January to August this year against the same period in 2024, incidents are up 20%. This concerningly signals a renewed upward trend in business thefts.
“The 20% spike we’re seeing now is a wake-up call for business owners,” says Kenny. “But what’s equally concerning is that it’s taking businesses nearly a month on average to lodge claims.”
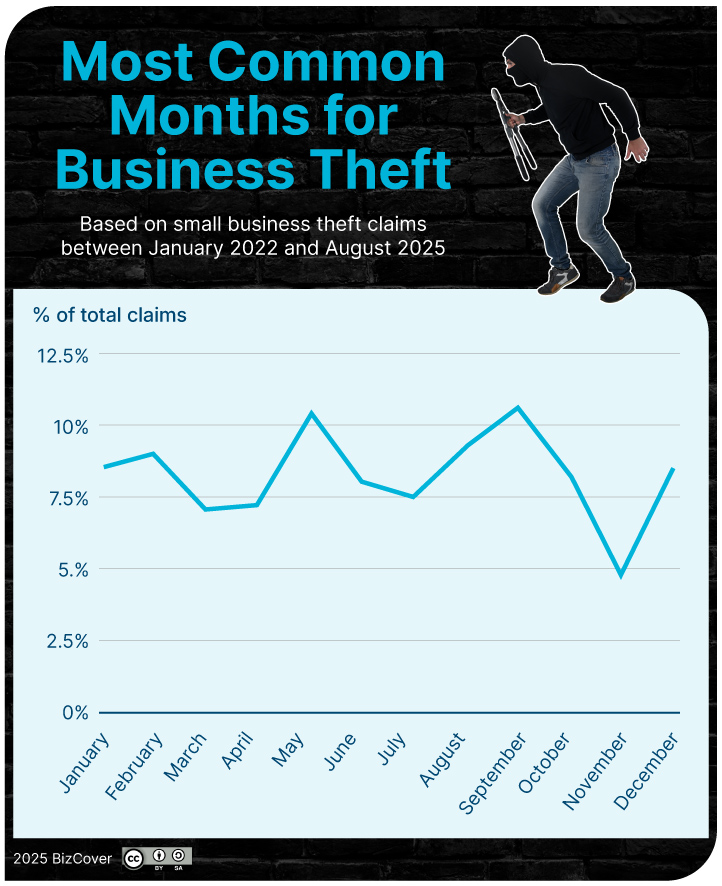
Months
Theft occurs year-round, but the data reveals distinct seasonal patterns. September has historically been the most common month for business theft, while November is the quietest.
While our 2025 data only extends to August, previous years consistently show late winter and early spring as peak periods for theft.
“This may come as a surprise to some – September doesn’t immediately seem like the prime time for theft activity,” says Kenny. “It could be tied to the shift from winter to spring. Businesses usually begin ramping up operations in preparation for spring and summer. Businesses may also be hiring seasonal casual staff, which could potentially create security gaps.
“Having this information on hand means that businesses can step up their security during higher-risk periods, rather than waiting until an incident occurs.”
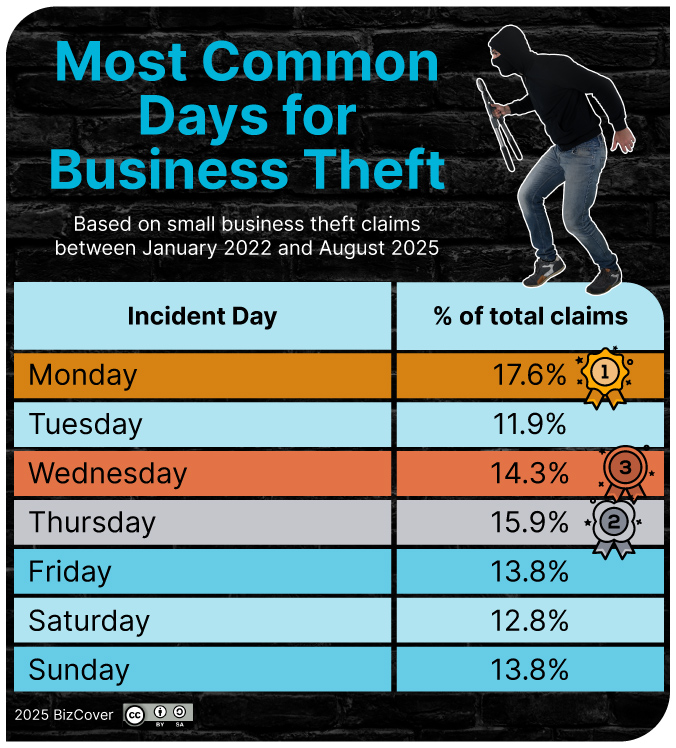
Days
The busiest theft day of the week for business thefts is Monday, followed by Thursday. Together, these two days account for roughly one-third of all incidents.
Tuesday is the quietest day, though theft occurs steadily across both weekdays and weekends. Unfortunately, this signals that there is no real “safe” day where business owners can afford to let their guard down.
On average, businesses took 24 days to lodge a claim after an incident occurred. This delay suggests that theft isn’t always identified immediately and may involve investigation, stocktake or administrative processes before reporting. It’s a stark reminder that the impact of theft often extends well beyond the day it happens.
This combination of rising incidents and delayed detection highlights why regular security audits and stocktakes are important for small businesses. The sooner a business can identify and report a theft, the better the chances of recovery and the less disruption to regular operations.
Where business theft occurs
Geography matters when it comes to business theft. Our data reveals clear hotspots at both the state and postcode level, offering valuable insights into where small businesses face the greatest risk.
By state
Victoria accounts for the highest share of business theft incidents, representing approximately 40% of all claims in our dataset. This substantial lead reflects the state’s high concentration of small businesses, particularly across Melbourne’s sprawling suburban and outer-metro commercial precincts.
Queensland follows at approximately 23%, while NSW ranks third at around 18%. Together, these three states represent roughly 80% of all theft claims. With high business density and sprawling outer-metropolitan commercial areas, it’s no real surprise that these three states account for such a high number of thefts.
WA is next, with a sharp drop down to 8%. This is then followed by South Australia (7%) and the Northern Territory (2%).
By postcode
Drilling down to postcode level reveals that Forestdale, Queensland, recorded the highest number of business theft incidents during our reporting period. This was followed by the Werribee region in Victoria. Deer Park area, again in Victoria, claimed third place. Werribee is located to the south-west of Melbourne, while Deer Park is located in the north-west. Both of these areas are roughly 30-40 minutes’ drive from Melbourne CBD. Forestdale is located approximately the same distance south of Brisbane CBD.
These locations are all outer-metropolitan areas where retail, trade and light-industrial businesses cluster.
“Having a business outside the CBD doesn’t mean that it’s safer,” says Kenny. “In fact, the combination of valuable stock and equipment, quieter surroundings and longer response times from authorities can make these locations more vulnerable.”
Conclusion
Our data shows that business theft in Australia is a widespread problem that seems to be on the rise. Food and drink businesses are bearing the brunt of theft incidents, while cash is the number one target for thieves.
Victoria leads the nation with 40% of all theft claims, and hotspots like Forestdale, Werribee, and Deer Park highlight the vulnerability of outer-metropolitan commercial zones.
Perhaps most worryingly is the 20% surge in theft incidents during the first eight months of 2025 compared to the same period in 2024. This is a sharp reversal after the brief decline seen in 2024.
But beyond the numbers, it’s the variety of stolen goods that truly illustrates the unpredictable nature of business theft. Cash, tools and tech seem obvious choices for thieves; but it seems that not even furniture, keys or mannequins are safe from sticky fingers.
Whether it’s regular stock or collectable, high-value items, virtually anything can be a target for thieves if they know what they’re looking for. This highlights the importance of considering insurance to help safeguard your business from theft claims.
“Business owners cannot afford to be complacent,” says Kenny. “These trends we’re seeing – rising incidents, diverse targets, reporting delays – all show that theft does not follow a predictable pattern.”
But while our data does reveal some alarming trends, business owners can still prepare themselves and protect their business assets with the right planning. Being aware of when and where incidents are most likely to occur, securing your premises, and considering insurance cover in case the worst does happen can all help protect your business from financial loss.
BizCover has been making insurance simple for small business owners since 2008. We make it easy for you to get multiple quotes online in minutes from selected Australian insurers.
Compare business insurance policies today.
Methodology
The analysis is based on business theft claims submitted to BizCover from across Australia between January 2022 and August 2025.
Each claim was reviewed and categorised by sector, business type, state, and postcode. Trends were analysed over time, including day of the week, month, and year of incidents, as well as the time taken to lodge a claim. This structured approach allows for identification of patterns in the frequency and type of business theft across Australian regions.
Manual keyword research was then applied, using a seed list of items to scrape claim descriptions and identify the most-stolen items and item categories.
While not a comprehensive record of all business theft in Australia, the dataset provides a strong indicator of trends across industries, states, and item types, based on BizCover-insured small businesses.
This information is general only and does not take into account your objectives, financial situation or needs. It should not be relied upon as advice. As with any insurance, cover will be subject to the terms, conditions and exclusions contained in the policy wording or Product Disclosure Statement (available on our website). Please consider whether the advice is suitable for you before proceeding with any purchase. Target Market Determination document is also available (as applicable). © 2025 BizCover Pty Limited, all rights reserved. ABN 68 127 707 975; AFSL 501769.